Cocoa price soars for more record highs, is it time to invest in Cocoa?
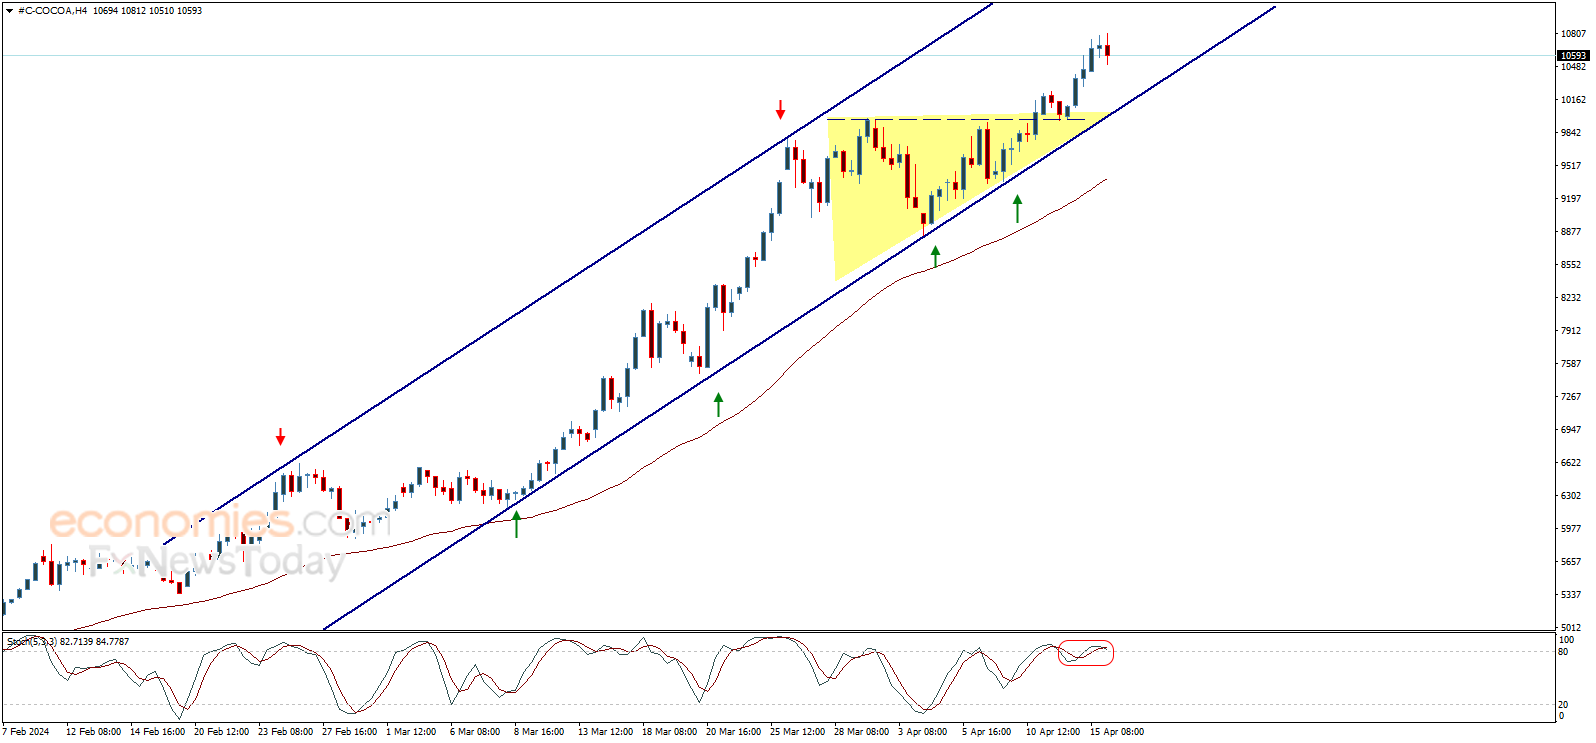
By studying Cocoa price chart, we find that the price triggered strong bullish wave since the first one of this year 2024, to start recording new historical high records and reach 10810$ areas now, and by checking the short-term and medium-term actions, we find that the price is moving within bullish channel that carries the price to achieve more expected rise in the upcoming period, noting that the next target of this channel reaches 11845$ areas.
The chart shows a group of positive technical factors that support the chances of continuing the bullish wave, starting from the EMA50 that keeps carrying the price from below, and protects trading inside the mentioned bullish channel, besides the completion of ascending triangle that forms positive factor to support the continuation of the bullish wave and head towards the suggested target.
On the other hand, there is a chance that the price could face some bearish corrections especially after reaching the waited target at 11845$, and it might rebound bearishly to test the bullish channel’s support line that we expect to form key barrier around 10300$ before turning back to rise again, to extend the positive targets and reach 13650$ areas on the longer-term basis.
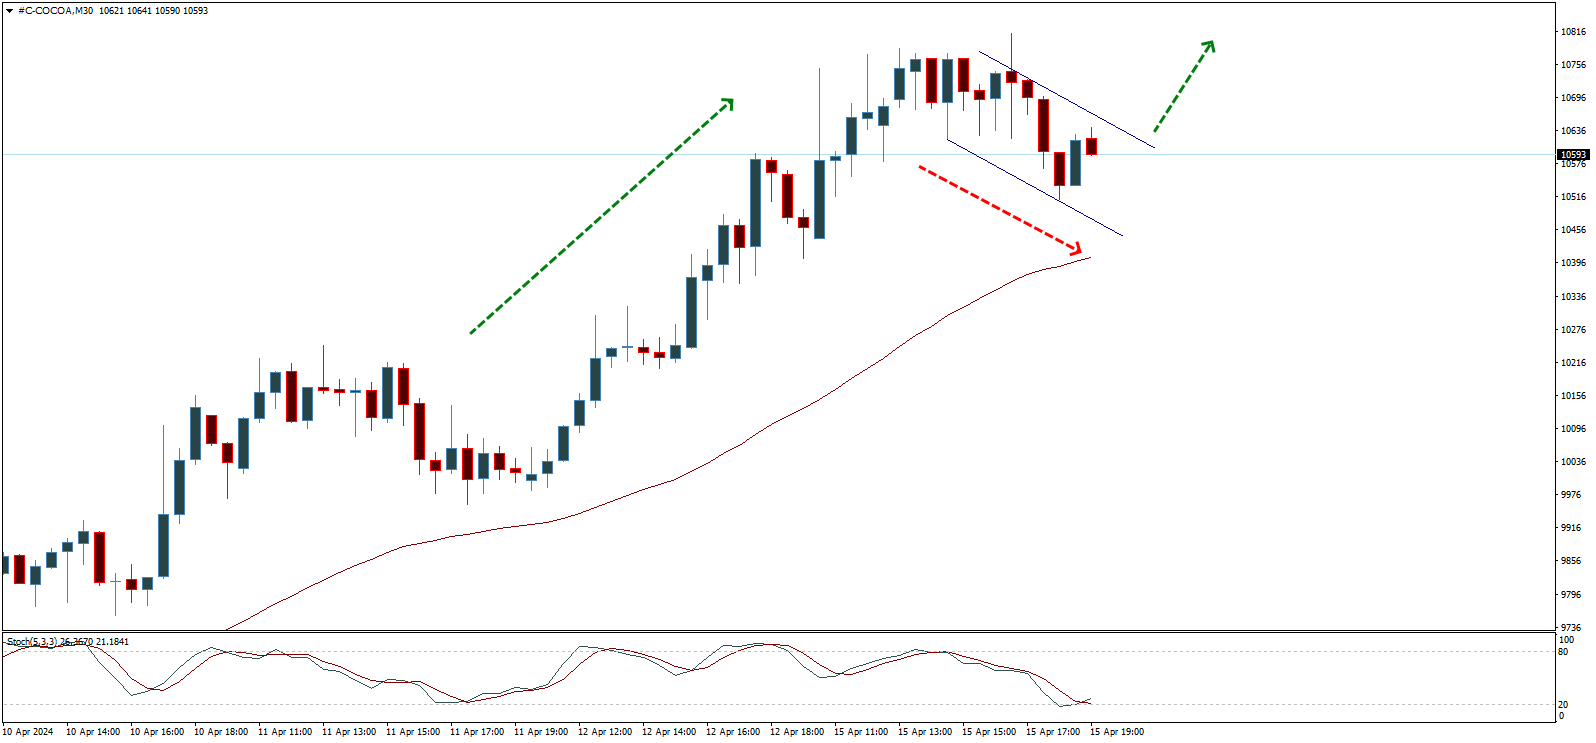
On the shorter-term time frames, we notice that the price fluctuates with temporary negativity now, moving inside minor bearish channel that we believe it forms bullish flag pattern, thus, breaching 10670$ will activate the positive effect of this pattern and push the price to resume the bullish towards the suggested targets.
Therefore, and when considering the mentioned factors, we believe that the chances valid to continue the rise and continue recording new historical highs, taking into consideration that holding above the psychological barrier 10000$ is important to continue the bullish trend, as breaking it will activate correctional bearish wave for the entire rise that started from the current year, to head towards visiting correctional bearish levels that start at 9210$ and might extend to 8215$ before turning back to rise again.
Key support levels:
10390, 10000, 9550, 9210
Key resistance levels:
10810, 11500, 11860, 1220
Brent oil price forecast update 16-04-2024

Brent Oil Price Forecast
- Brent oil price finds solid resistance at 90.90$, to show negative trades and test the EMA50 that forms key minor support at 90.00$, and the price needs to hold above this level as a first condition to the continuation of the expected bullish trend for today, which its next target located at 93.40$.
- On the other hand, we should note that breaking 90.00$ followed by 89.20$ levels will put the price under more negative pressure to head towards visiting 87.40$ areas on the near-term basis.
The expected trading range for today is between 89.00$ support and 92.80$ resistance.
Trend forecast: Bullish
Crude oil price forecast update 16-04-2024

Crude Oil Price Forecast
- Crude oil price trades negatively to press on 85.45$ support line, which urges caution from the upcoming trading, as confirming the break and holding below this level will push the price to turn to decline for the rest of the day and head towards 83.30$ mainly, while the price needs to consolidate above the mentioned support to revive the bullish trend that its next target located at 87.60.$.
The expected trading range for today is between 84.50$ support and 87.00$ resistance
Trend forecast: Bullish
Silver price forecast update 16-04-2024

Silver Price Forecast
- Silver price faces clear negative pressure now, to approach the key support 28.00$, which urges caution from the upcoming trading, as breaking this level will complete forming negative pattern that has the ability to push the price to achieve bearish correction that targets testing 26.90$ direct.
- Until now, the bullish trend scenario still valid unless breaking 28.00$ and holding below it, reminding you that the next main target of the current bullish wave is located at 29.80$.
The expected trading range for today is between 28.00$ support and 29.00$ resistance.
Trend forecast: Bullish